CN Graphs & Charts
- Ceny
-
Bezpłatny plan jest dostępny. Dostępna darmowa wersja próbna.
- Ocena
- 5,0 (1)
- Deweloper
- Common Ninja
Wyróżnione obrazy w galerii


Turn your store’s data into sales with stunning, interactive charts that drive conversions.
Transform store data into visuals that sell. Create 20+ chart types, from bar to interactive pie, and place them anywhere in your store to grab attention and keep visitors engaged. Import from CSV or Google Sheets for instant updates, or connect live data sources for automatic refreshes. Customize colors, fonts, and layouts to perfectly match your brand. Ideal for product comparisons, tracking promotions, and showcasing customer reviews. Fully responsive, lightning-fast, and designed to turn b
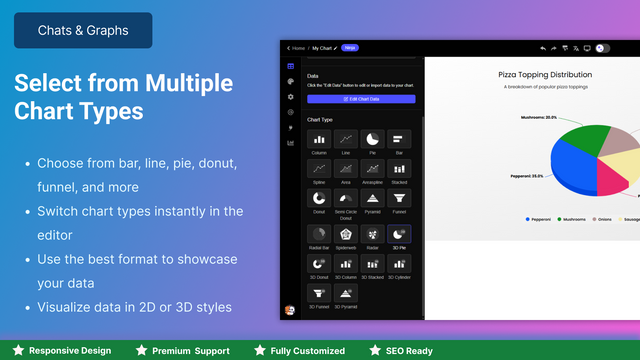
- 20+ chart types to present store data, engage visitors, and boost sales.
- Auto-sync from CSV or Sheets to keep your charts up to date.
- Professional templates to launch stunning charts in under 2 minutes.
- Full brand control with custom fonts, colors, and chart layouts.
- Embed charts anywhere, products, blogs, or landing pages.
Języki
Angielski
Ta aplikacja nie została przetłumaczona na język Polski
Współpracuje z
- Airtable
- csv
- Google Drive
- Notion
- One Drive
- XML
Kategorie
Typy zawartości
Tworzenie treści
Ceny
Free Plan
Gratis
Funkcje
- 2 Charts
- 1 Series
- 10 Data rows
- 3 Charts types
- Custom fonts
Basic Plan
$5 /miesiąc
albo $48/rok, co pozwala oszczędzić 20%
Funkcje
- 10 Charts
- 3 Series
- 30 Data rows
- 6 Charts types
- Custom design
- Ads Removal
3-dniowa darmowa wersja próbna
Pro Plan
$10 /miesiąc
albo $96/rok, co pozwala oszczędzić 20%
Funkcje
- 200 Charts
- 10 Series
- 500 Data rows
- 13 Charts types
- CSV Importer
- Auto data refresh
- Ads Removal
3-dniowa darmowa wersja próbna
Business Plan
$15 /miesiąc
albo $144/rok, co pozwala oszczędzić 20%
Funkcje
- 1,000 Charts
- 50 Series
- 5,000 Data rows
- 20 Charts types
- Dynamic data from URL
- CSV importer
- Ads Removal
3-dniowa darmowa wersja próbna
Wszystkie opłaty są naliczane w USD. Opłaty cykliczne i zależne od użytkowania są pobierane co 30 dni.
Recenzje (1)
- 100% ocen to oceny z 5 gwiazdkami
-
0% ocen to oceny z 4 gwiazdkami
-
0% ocen to oceny z 3 gwiazdkami
-
0% ocen to oceny z 2 gwiazdkami
-
0% ocen to oceny z 1 gwiazdkami
I searched all over looking for an interactive graph & charting app that would be able to show a visual representation of data. This is a great tool to use when you have a product that may be simial to your competition but you have the ability to show the data in an interactive visual graph or chart that sets you apart from the competition. I had a visual issue with how the line graph was appearing on a mobile device and I reached out to the support team over at Common Ninja and worked with Daniel who provided me with a quick and precise solution to the visual issue I was experiencing. I'm looking forward to seeing what the team over at Common Ninja is able to develop for more interactive and complex graph plotting abilities in the future.
Pomoc techniczna
Pomoc techniczną dla aplikacji zapewnia Common Ninja.
Zasoby
Ten programista nie oferuje bezpośredniego wsparcia w języku: Polski.
Deweloper
Wprowadzenie na rynek
12 sierpień 2021
Więcej podobnych aplikacji
Spełnia nasze najwyższe standardy w zakresie wydajności, projektu i integracji. Dowiedz się więcej Otwiera się w nowym oknie
