
Debug Your App With System Developer Tools
The Developer Tools Menu provides a number of options that provide real-time metrics and other information about your app. This information can assist you in troubleshooting, development, and testing.
- Invoke the Developer Tools menu
- System X-Ray
- Configuration Panel
- Safe zone
- Network Proxy
- Launch Network Advisor
- Related topics
This article explains the system Developer Tools menu for live debugging when the developer isn't connected over the Android Debug Bridge (ADB). The article also shows you how to set up a network proxy. A developer account setup isn't needed. The overlay presented is mostly for app performance, but the network proxy is used for pre-production development.
Invoke the Developer Tools menu
You can invoke the Developer Tools menu in several ways:
- Remote Control: On the directional pad, press and hold the Center button for one second. Then—still holding down Center—press the Down button too. Hold both buttons for three to four seconds. Then release both buttons and press the remote's Menu button. If this doesn't work, try holding Center and Down simultaneously instead of staggered.
- Vega CLI: If Vega CLI is enabled on Vega TV and a computer is connected, you can run the following command to invoke the dialog box:
vega device launch-app -appName com.amazon.ssm.main.
The following screenshot shows the options in the Developer Tools menu:
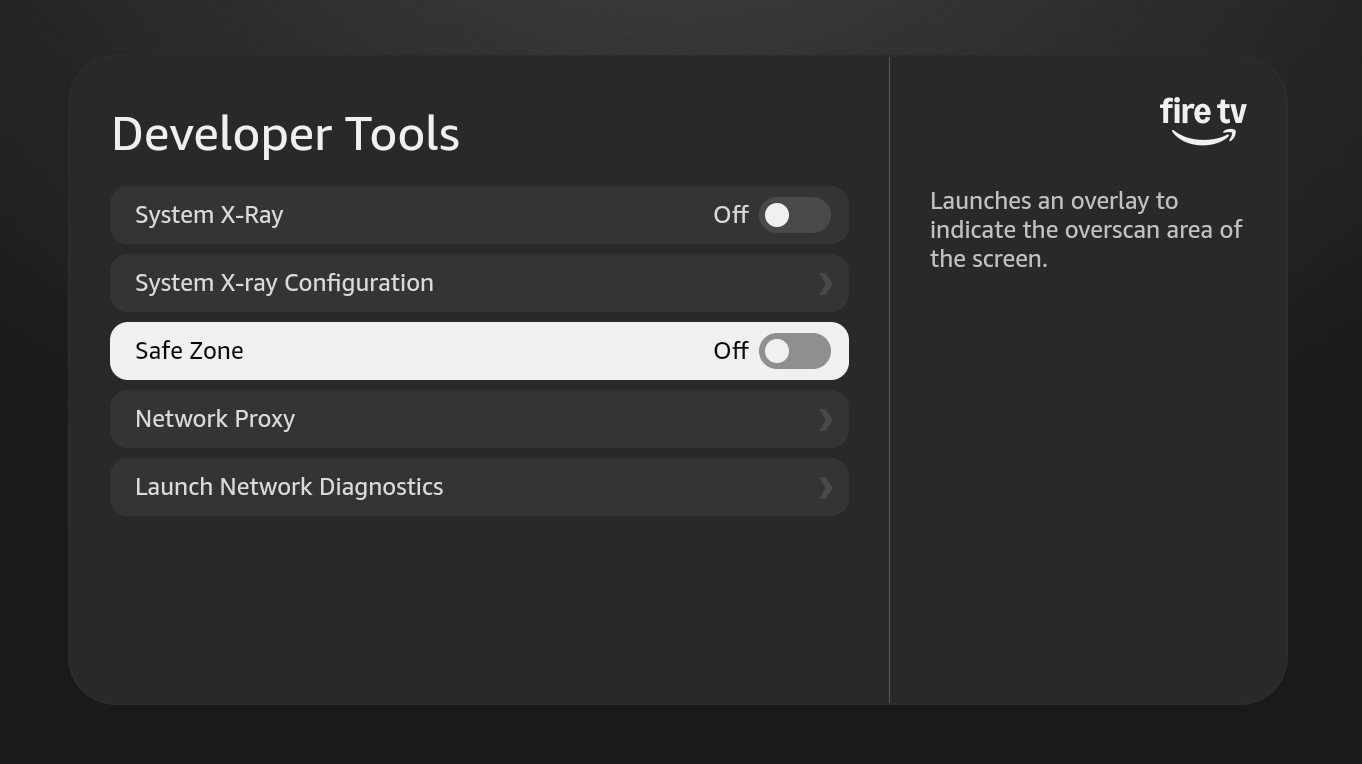
The various panels are explained:
System X-Ray
System X-Ray gathers instantaneous system metrics and displays them at the top of the screen as an overlay. When toggled on, the overlay is visible on the screen until it's disabled or the device turns off.
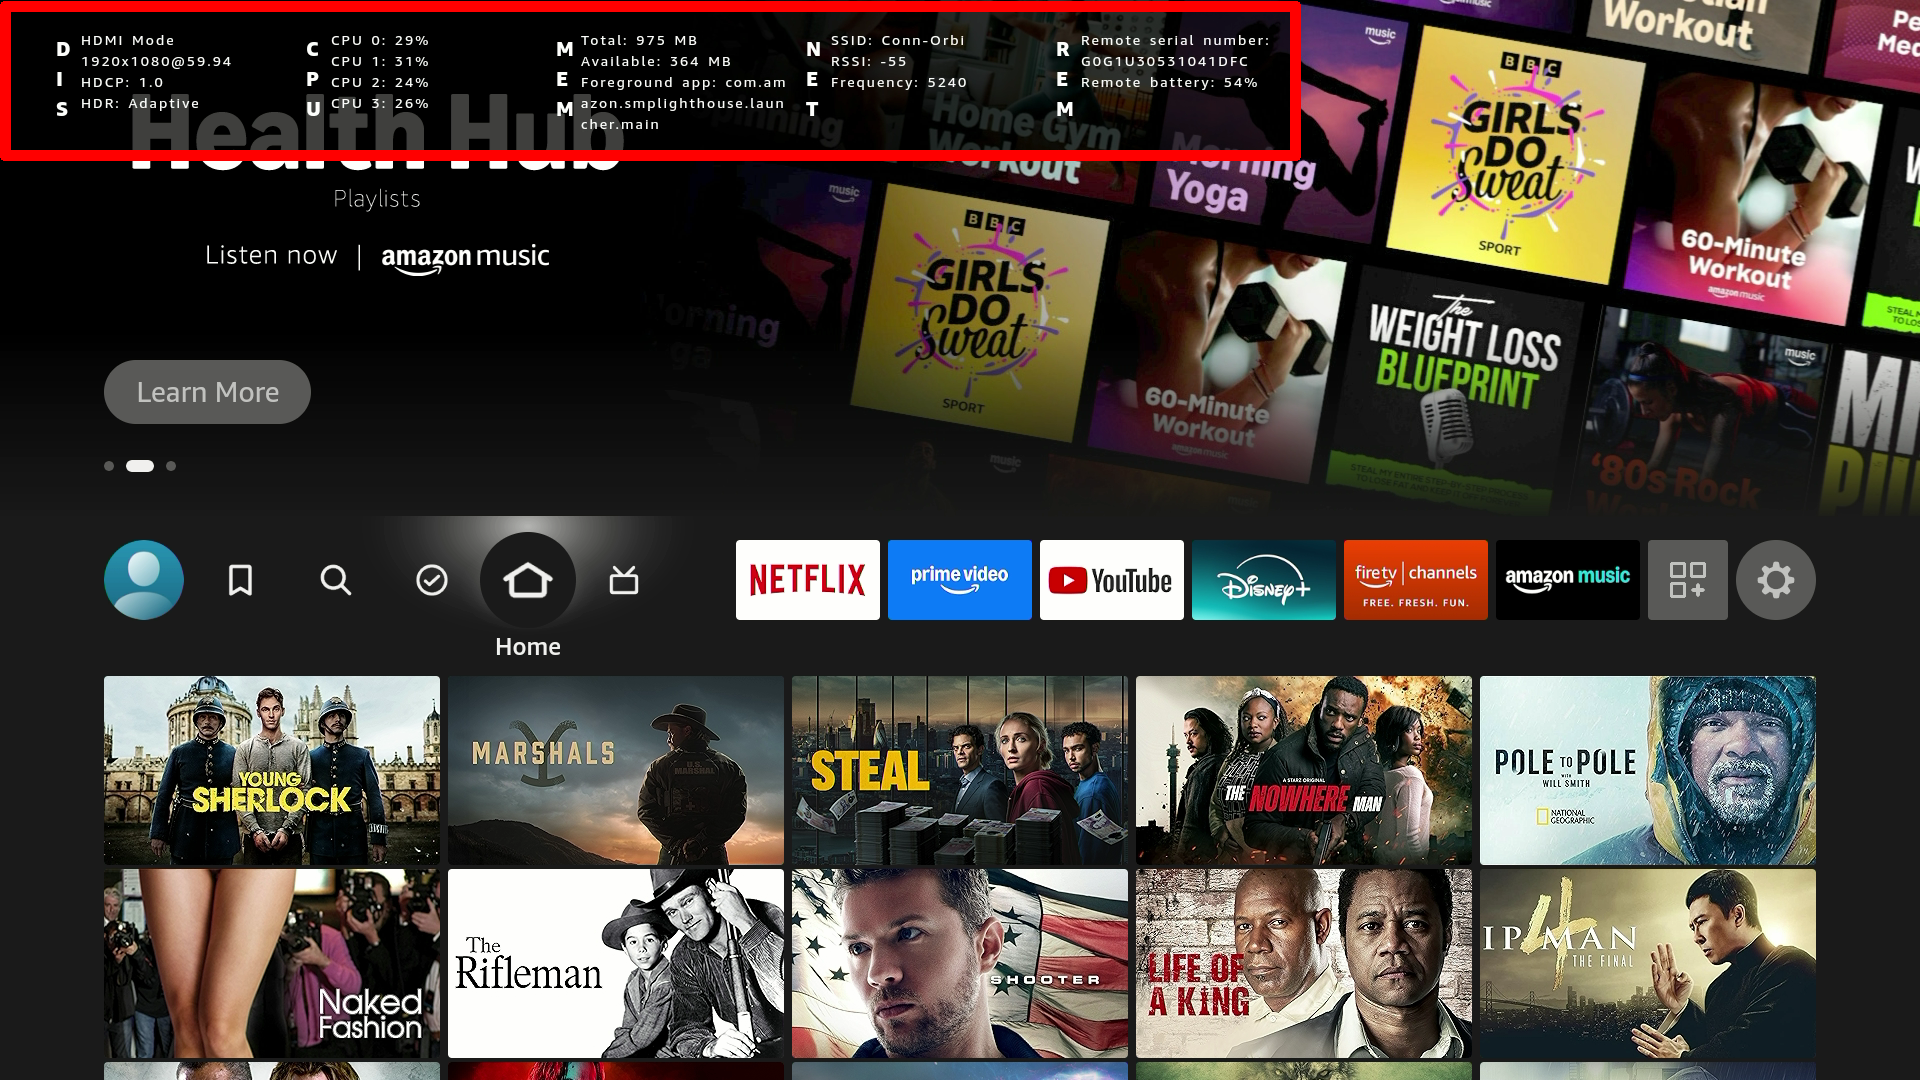
The System X-Ray overlay contains details about the following:
- Display
- CPU
- Memory
- Network
- Remote
To learn more about System X-Ray, see System X-Ray.
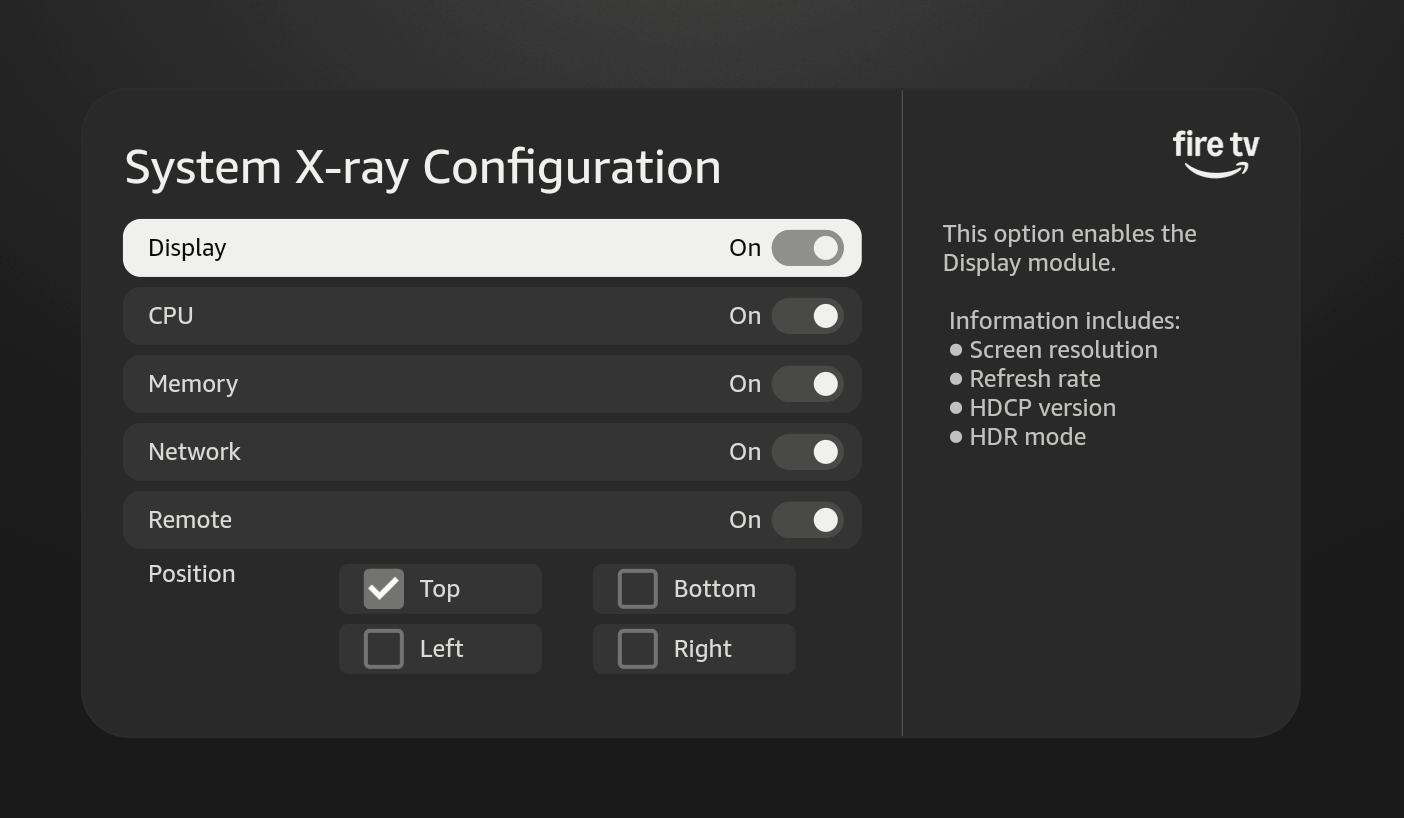
Configuration Panel
The configuration panel lets you customize the System X-Ray overlay. This panel allows you to set which fields are displayed and where on the screen the fields appear.
Safe zone
Some TVs use overscan with their display. Overscan means that the TV displays some information off the edges of the visible screen to accommodate discrepancies in monitors. However, you shouldn't display important information in the overscan areas.
To make the overscan areas visible, you can turn the Safe Zone switch to On. The On setting makes the overscan areas apparent so you can avoid displaying any information in these areas.
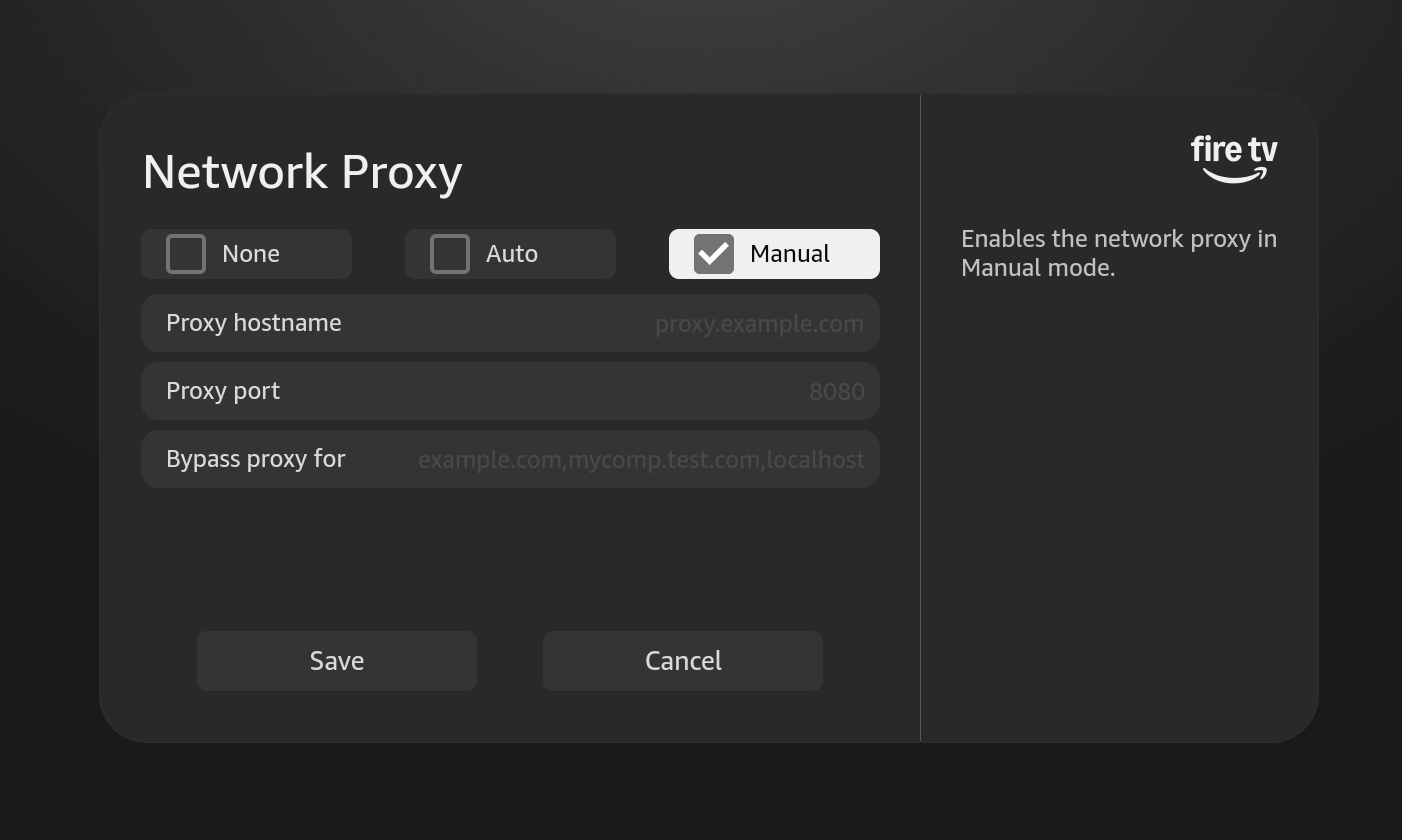
Network Proxy
If your app communicates with remote services or websites, it's often useful to inspect the HTTP or HTTPS traffic it generates. This includes requests initiated by your app and the responses it receives. It also includes HTTP headers containing—among other things—cookies and caching information. See Network Proxy for more details.
Launch Network Advisor
Network Advisor launches a network analysis window that checks your network connection strength, channel, and other details. If there are problems, the Network Advisor provides recommendations to fix the issues.
Related topics
For more details:
Last updated: Feb 17, 2026